
How to Use The Keltner Channel For Forex Trading
Keltner Channel is a technical indicator that provides traders with strong continuation signals and trend directions by assessing a currency pair's price volatility. Understanding the Keltner Channel indicator enables traders to place better entry orders and predict market reversals. In this article, we take a look at how the Keltner Channel works and how you can incorporate it in your trading strategy.
What is the Keltner Channel?
Keltner Channel is a volatility trading indicator that includes a set of bands that are placed above and below the currency pair's price to determine its trend direction. The upper band depicts a price expansion, whereas the lower band depicts a price contraction. The indicator uses market volatility or Average True Range to depict continuation patterns by breaking below or above the top and bottom bands.
- When the currency pair prices reach the upper band, it indicates a bullish market momentum, signalling traders to enter the market
- When the currency pair prices reach the lower band, it indicates a bearish market momentum, signalling traders to exit the market
Both the lower and upper bands indicate how deviated the currency pair prices are from its mean price and if the market is oversold or overbought.
- An overbought market is when the currency pair prices trade above actual price, on the upper band
- An oversold market is when the currency pair prices trade below the actual price, on the lower band
The pattern includes:
- An upper channel band depicting overbought levels which is calculated as the 20-period Exponential Moving Average + [ 2 * Average True Range]
- A lower channel band depicting oversold levels which is calculated as the 20-period Exponential Moving Average – [ 2 * Average True Range]
- A middle line which is the 20-period Exponential Moving Average itself
What are the top Keltner Channel strategies?
Bollinger Bands and Keltner Channel
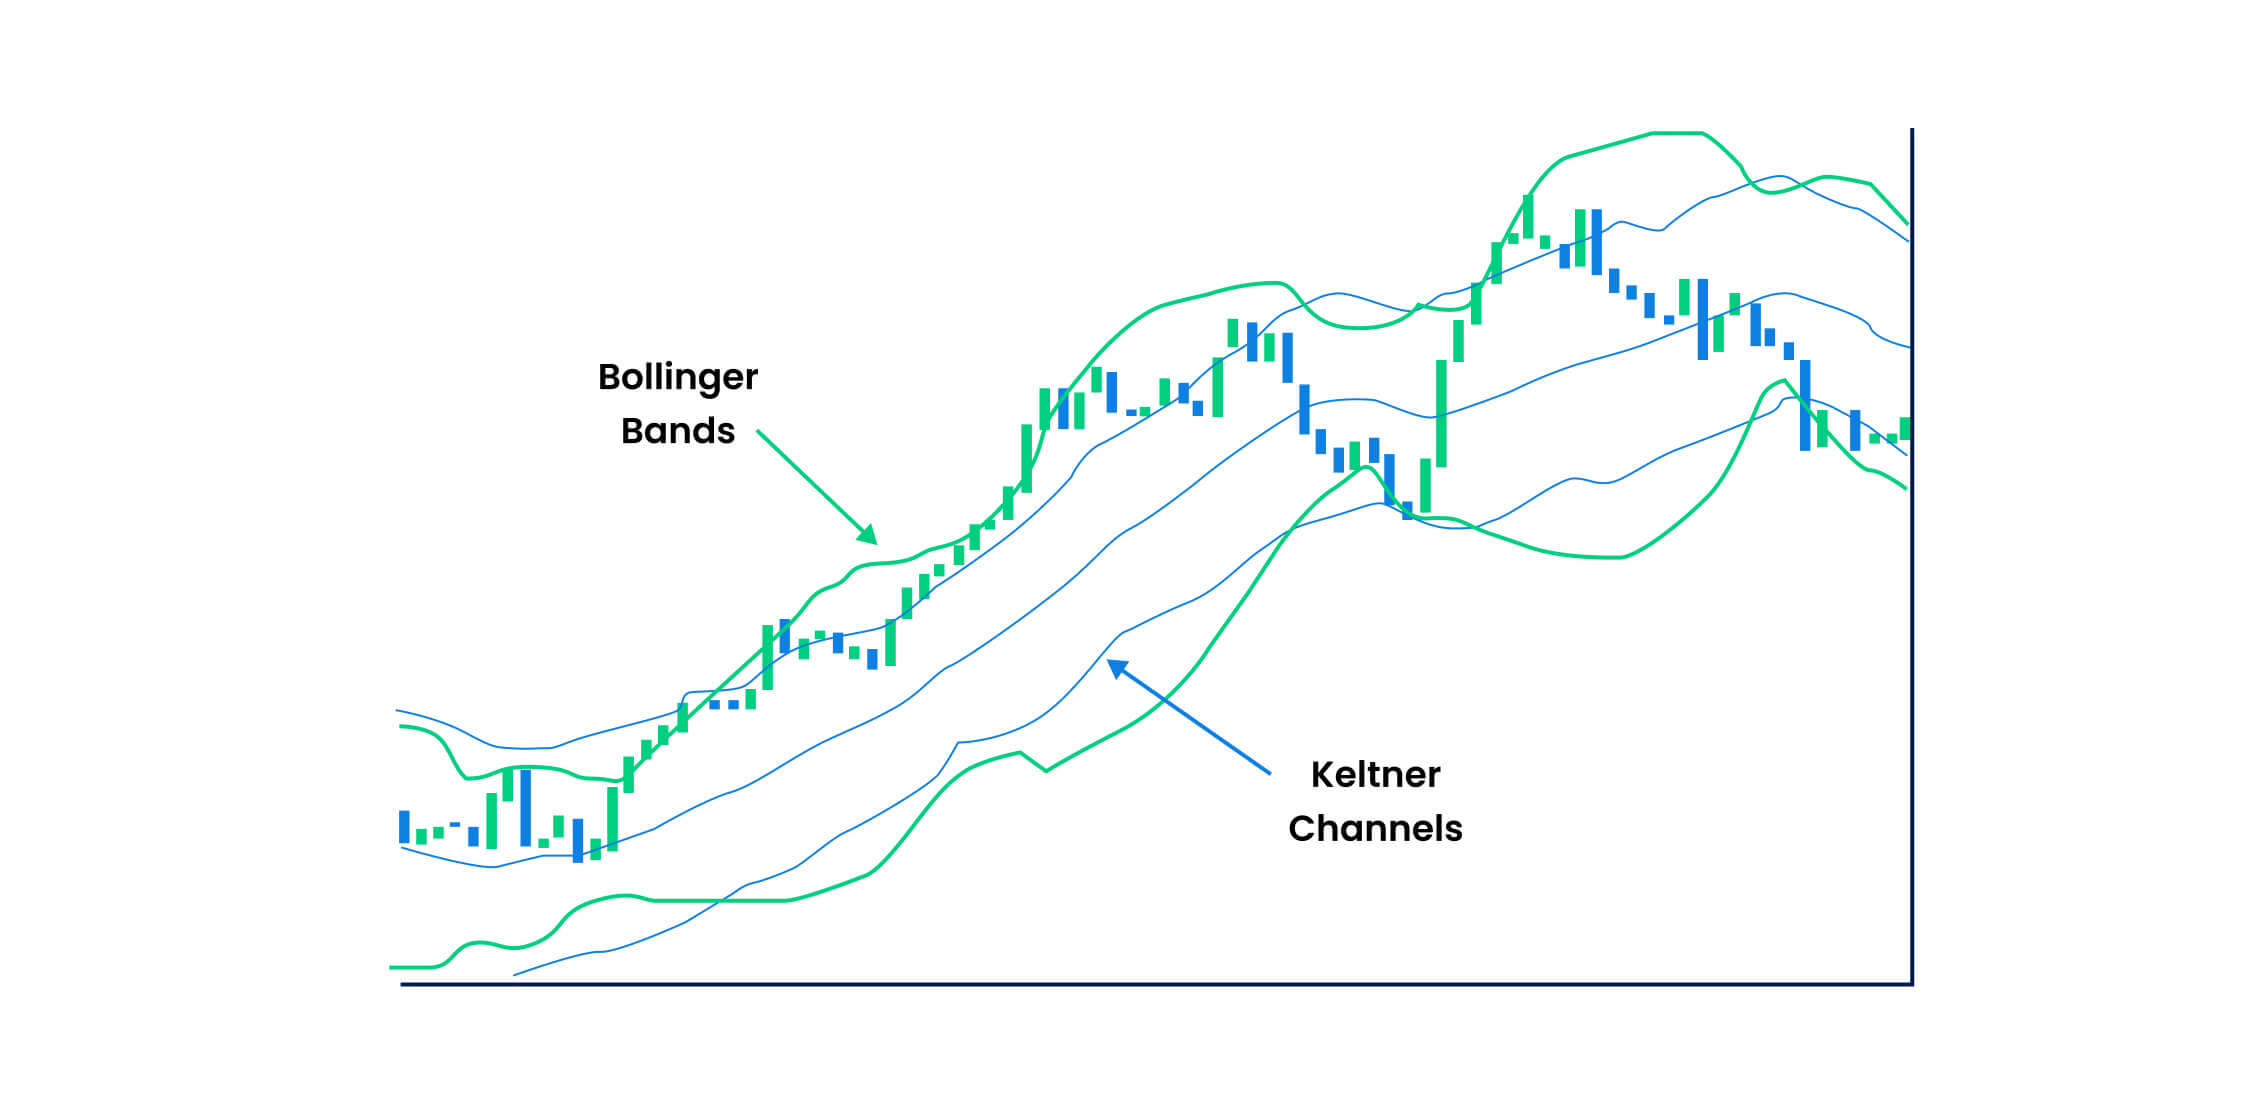
Bollinger Bands use trend lines that are a few standard deviations away from the average price of a currency pair to determine if the markets are overbought or oversold. When combined with the Keltner Channel, the Bollinger Bands Keltner Channel strategy provides traders with a strong trend direction and market volatility that can be used to better time the entry orders.
- When the Bollinger Bands squeeze inside the Keltner Channel, the market is less volatile, with a potential breakout in place. It suggests traders take long positions to benefit from the increasing market in the future.
- When the Bollinger Bands squeeze inside the Keltner Channel, and the market starts trading flat after a price high, the bands contract and suggest traders exit the market with a sell order.
Keltner Channel and Donchian Channels
Donchian channels are formed with the highest high and lowest low price of a currency pair that help traders identify entry and exit signals. The currency pair price fluctuations are studied through these channels to also understand a new or continuous trend in the market to place long and short orders. When combined with the Keltner Channel, market trends along with ideal entry and exit points are confirmed by comparing the high and low prices with the upper and lower bands. An uptrend takes place as soon as the currency pair price exceeds the range high price, and a downtrend is confirmed as soon as the currency pair price crashes below the range low price.
- Buy or long signals are sent to traders whenever the currency pair price moves beyond and closes above the upper band
- Sell or short signals are sent to traders whenever the currency pair price closes below the lower band
How to trade with the Keltner Channel
1. Pullbacks
A trader can use the Keltner Channel during a solid trend to trade pullbacks. The currency pair price behaviour around the lower and upper bands indicate the strength of a trend.
- If the currency pair price is trading near to the upper band, it indicates a strong bullish trend
- If the currency pair price is trading near to the lower band, it indicates a strong bearish trend
The Keltner Channel provides traders with an area where the currency pair price potentially bounces either upward or downward, signalling traders to take long or short positions, respectively.
2. Ranging Markets
In a ranging market, the currency pair prices do not usually touch the upper band or the lower band. The currency pair prices mostly trend near the middle band in this case. The Keltner Channel bands can be used to trade the ranging market by combining it with a Relative Strength Index indicator that helps traders measure overbought or oversold market conditions.
- Enter a long position if the currency pair price breaks above the middle band
- Enter a short position if the currency pair price breaks below the middle band
- Buy orders are signalled whenever the RSI value is below 10 as it indicates an oversold market
- Sell orders are signalled whenever the RSI value is above 90 that, as it indicates an overbought market
2. Breakouts
Keltner Channel can be used to trade breakouts when the market is volatile. You can combine the Keltner Channel with the Average Directional Movement index that depicts the strength of a breakout in the forex market. Readings of the ADM Index above 20 signal a new trend beginning, and readings below 20 indicate market indecision or weak trends. The higher the reading of the Average Directional Movement index, the stronger the trend in the market.
- Enter a buy position when the Keltner Channel bands are flat, and currency pair price breaks beyond the upper band with the Average Directional Movement index crossing the reading of 20 that signals an upward market continuation
- Enter a sell positional when the Keltner Channel bands are flat, and currency pair price breaks below the lower band with the Average Directional Movement index dipping below the reading of 20 that signals a downward market continuation
Trade with the Keltner Channel to identify market trends
Trading with the Keltner Channel helps traders identify strong market trends, trade pullbacks and seamlessly identify ideal entry and exit signals. Once you combine the Keltner Channel with other technical indicators, new trading opportunities emerge that can help you become a successful forex trader. Ready to use Keltner Channel to profit from your forex trades? Sign up for a live trading account or try a risk-free demo account on Blueberry Markets.
Recommended Topics
-
Top Pivot Point Strategies
Pivot point analysis can predict not only price movements but also help time entries and exits correctly to develop a risk management strategy.
-
How to Use The Bill Williams Indicator
Bill Williams Indicator is helpful in analysing trending markets, reversals and momentum.
-
How to Use Relative Vigor Index in Forex
The Relative Vigor Index (RVI) is a technical analysis indicator that helps measure a trend’s strength in forex trading.
-
Technical Trading Strategies for Day Traders
Technical trading strategies for day traders include technical analysis tools to identify short-term trading opportunities in the market.
-
How to Use The Force Index Indicator in Forex?
The Force Index indicator combines the currency pair’s price and volume to determine the power of bulls and bears in the market.
-
The Ultimate Guide to Trading Trends in Forex
Trading trends in forex provides you with opportunities to identify the strong market direction and enter an order accordingly.
-
MT5 Indicators Every Trader Should Know
MT5 is a forex and stock trading platform that enables traders to place automatic orders.
-
What is Volume Trading Strategy
Volume trading in forex is all about trading currency pairs with high buying or selling pressure.
-
Top Low Spread Scalping Strategies For Forex Traders
Scalping strategies allow traders to leverage on the small price changes in the forex market to turn the trends in their favour.
-
What is Forex Currency Swap?
Forex currency swap helps reduce foreign borrowing costs and mitigate exchange rate risks.
-
What is Forex Spot Trading
With forex spot trading, one can make significant short-term profits by trading at prevailing prices.
-
How to Short Sell a Currency
Short selling enables traders to place lucrative forex orders even in a falling market.
-
How to Use The Chaikin Money Flow Indicator
The Chaikin Money Flow indicator provides future market direction by analysing the strength of the market trend and underlying buying or selling pressures.
-
What is Momentum Trading? Top Momentum Trading Strategies
Momentum trading leverages market volatility to the trader’s advantage by identifying the strength of the market’s current trend.
-
How to Trade With VWAP Indicator in Forex
The Volume Weighted Average Price (VWAP) helps eliminate any unwanted price fluctuations during the trading period.
-
5 Top ADX Trading Strategies
The Average Directional Movement Index (ADX) strategy measures the forex market’s overall strength.
-
How to Identify a Trend in the Forex Market
Identifying market trends in forex is also helpful in understanding if your trading strategy is going as per plan and where you can improve.
-
Forex Trading Robots: How Do They Work?
Forex trading robots make multitasking possible by processing multiple conditions like order entries/exits and entering stop loss orders automatically.
-
What Are Momentum Indicators in Forex
Momentum indicators measure how strong the price change is in the currency pairs.
-
How to Use Gator Oscillator For Forex Trading
Gator Oscillator helps in identifying a trending or consolidating market.
-
What is The Exponential Moving Average
Exponential Moving Average (EMA) helps in understanding the market’s trend direction.
-
Top Forex Volatility Indicators
Forex volatility defines the risk an investor takes in the market. The higher the volatility, the greater the risk and the higher the potential returns.
-
How to Use Forex Market Sentiment Indicators
Sentiment indicators in the forex market indicate extremely volatile market conditions.
-
How to Use The Hanging Man Candlestick Pattern For Forex Trading
The Hanging Man Candlestick pattern provides downtrend reversal signals, which helps traders place sell or short orders to profit off falling markets.
-
How to Add MT4 Indicators
MetaTrader 4 comes with several built-in and custom indicators to boost your trading strategy.
-
Top MACD Trading Strategies
Moving Average Convergence Divergence (MACD) strategies enable traders to measure market momentum and trend strength.
-
Top Indicators for MT4
MT4 indicators help analyse forecasted currency pair prices and place exit or entry orders accordingly.
-
How to Trade Bullish and Bearish Divergences
Bullish and bearish divergences enable you to trade market reversals.
-
Top Support and Resistance Indicators
Support and Resistance indicators identify price points on the forex chart where the markets can potentially reverse.
-
What is The Donchian Channel Indicator
The Donchian Channel indicator can determine volatility and potential breakout signals in the market.
-
How to Install MT4: A Beginner's Guide
MetaTrader 4 (MT4) is a powerful forex trading platform with a user-friendly interface and advanced analytical tools for automating trading.
-
What are Trendlines in Forex Trading?
Trendlines in forex provide clear market signals for placing long or short orders.
-
Market Order vs Limit Order
Market and Limit orders help execute automatic trading transactions, as per your trading preferences.
-
Bearish and Bullish Markets
In the trading world, it is essential to be aware of the bull and bear market trends because they define the direction of the market
-
How to Read Trading Charts
Trading forex live charts can help identify ongoing market trends, which can help you place successful traders.
-
Top Reversal Patterns For Forex Trading
Reversal patterns provide traders with price levels at which the market can potentially reverse.
-
How to Find The Best Forex Trading Signals
Forex trading signals are important market triggers that provide traders with ideal entry and exit price levels in the market.
-
Top Forex Trading Strategies That Actually Work
Trading in forex, you will come across several forex trading strategies -- some more complex than the others. It is immensely crucial to start forex trading with the right strategy.
-
Scalping vs Swing Trading: What’s the Difference?
Every forex trader has a different purpose, objective, time constraints, and investment capital. The right forex trading style for you depends on your main trading goals and requirements.
-
What are Volume Indicators
Volume in the forex market can be used to determine the upcoming market trends. Volume indicators are forex trading indicators that can identify if the volume for a particular currency pair is high or low, providing traders with market continuation and reversal signals
-
Shooting Star Candlestick Pattern
The Shooting Star Candlestick Pattern can identify bearish market reversals and provide traders with ideal price levels to short or exit the trade.
-
Top Trading Chart Patterns
Predicting future currency pair prices help in confirming market continuation and reversal signals.
-
What is Slippage in Forex Trading?
Slippages occur when a currency pair order is executed at a price different from the set market order price.
-
Buy limit vs Sell Stop Orders in Forex
Placing buy limit and sell stop orders help employ a price control strategy on forex trades. Let's take a look at buy limit vs sell stop orders.
-
The Best Time Frame For Forex Trading
A time frame is a designated time period where forex trading takes place. Time frames can be measured in minutes, hours, days, weeks, months and years.
-
Top Technical Indicators in Forex
Technical indicators are a market direction signal based on the current and historical price movement of a currency pair that provides traders with future price expectations
-
Top Continuation Patterns
A continuation pattern indicates if the current market trend is going to continue in the same direction or not
-
How to Ace Divergence Trading in Forex
The forex market is all about timing your trades well. Divergences give traders a market reversal signal right before a price trend changes
-
How To Trade Forex With Japanese Candlesticks?
A Japanese Candlestick is a technical analysis tool used to analyze the currency pair’s price movement in the forex market.
-
Top Momentum Indicators To Analyse Trend Strength
Momentum indicators are technical analysis tools that determine in which direction the market is headed and how strong or weak the ongoing trend is
-
Types of Moving Averages Every Trader Should Know
Moving Average is a technical indicator which averages out currency pair prices in a specific time period in order to accurately identify market trend reversals and support-resistance levels.
-
8 Popular Intraday Trading Indicators
Intraday Trading Indicators help place successful short-term trade orders in the forex market.
-
What is the Tweezer Candlestick Formation?
The Tweezer Candlestick formation is a reversal pattern that indicates either a market top (strong uptrend) or market bottom (strong downtrend)
-
Average Directional Index
The ADX is a strength indicator that measures how strong or weak a particular market trend is.
-
How to Use Elliott Wave Theory For Forex Trading?
The Elliott Wave Theory analyses a currency pair’s long-term price movement in the forex market.
-
What are Pivot Points in Forex
Pivot Points help traders identify market reversals. With Pivot Points, traders can predict the support and resistance levels of a currency pair to make entry and exit decisions.
-
Leading vs Lagging Indicators
Leading and lagging indicators help traders measure the future and current performance of a currency pair, respectively. These indicators can help make successful trading decisions.
-
What is Relative Strength Index?
Relative Strength Index (RSI) helps traders understand how frequently the currency pair prices change in the forex market to predict the future market prices.
-
Wide Ranging Bars
Wide Ranging Bars are strong momentum indicators that help traders understand the market direction and identify ideal entry and exit points.
-
Harmonic Price Patterns in Forex
Harmonic Price Patterns allow traders to predict future price movements and trend reversals to make ideal entry and exit decisions in the Forex market.
-
Double tops and bottoms
Double Tops and Double Bottoms chart patterns help traders identify solid bullish and bearish trend reversals in the Forex market, and in turn, find the ideal market entry and exit points.
-
Falling and Rising Wedges
When you are trading currency pairs in the Forex market, it is essential to know when the market can possibly reverse. The Falling and Rising Wedges pattern help identify market reversal signals and accurate market entry and exit points.
-
Forex Scalping Strategy
Scalping refers to trading currency pairs in the Forex market based on real-time analysis. With Forex scalping, you hold a position for a very short period and close once you see a profit opportunity.
-
Symmetrical Triangle Pattern
Symmetrical Triangle Patterns help identify market breakdowns (price fall) and breakouts (price rise), and in turn, help you plot the entry and exit prices for profitable Forex trading.
-
Introduction to Technical Analysis in Forex
Technical analysis in Forex trading provides you with significant market trends, reversals and fluctuations and in turn helps you long and short term trades.
-
Trading breakouts and fakeouts
Breakout and fakeout trading enable traders to take positions in rising and falling markets.
-
Fundamental Analysis in Forex Trading Explained
Fundamental analysis in Forex trading is one of the several methods you can use to determine the relative security and intrinsic value of a nation’s currency.
-
8 Top Commodity Trading Strategies
Commodity trading is one of the best ways to diversify your portfolio and protect yourself from losses incurred due to inflation.
-
What is a Doji Candlestick?
The Doji Candlestick is a pattern used in technical analyses of trend reversals in a market.
-
Moving Average: The Complete Guide
Moving Average is used in Forex trading to compare the current currency pair pricing and where it stands with respect to the current average pair prices.
-
What is Volatility Index (VIX) and How Do You Trade It?
One of the most popular trading markets in the world, the foreign exchange market allows investors to make quick money by trading currencies.
-
Forex Profit Calculator
On average, a Forex trader can make anywhere between 5 to 15% of the initial amount they invested in the market.
-
Understanding markets gaps and slippage
The foreign exchange rate reveals valuable details about particular currencies a trader wishes to trade-in.
-
What is a pip in forex?
When trading in the Forex market, you need to have a close eye on two currencies at the same time. PIP helps you denote the change in a currency pair’s value.
-
Introduction to Order Types in Forex
Forex has different order types which allow traders to automate entering and exiting positions.
-
Using orders to manage risk
Forex risk management includes a robust set of rules and regulations that protect you against Forex's negative impacts.
-
Managing risk in 7 steps
Risk management in Forex is essential to individuals, groups of individuals, and organizations since it enables them to implement measures that help mitigate Forex risk and its negative impact.
-
Bullish and Bearish Flag Patterns
Blueberry Markets discusses why it is essential to study the bullish and bearish flag patterns in Forex. Learn more.
Advanced
Master risk management and
become an expert forex trader.
Move on to the advanced course.
Guide to Forex
Trading indicators.
Enter your details to get a copy of our
free eBook

Start a risk free
demo account
News & Analysis
Catch up on what you might
have missed in the market.
